Data Loggers
Overview
Main features include: Mobility, Ease of use, Adaptability and Affordability
Data is displayed in graphs and tables, which are easily displayed, printed and exported
Multiple sensors can be combined in the same Dashboard and/or graph
A good example of this device’s application is it can be used to review performance of the cooling systems
in grocery stores where electricity bills are higher than normal
Benefits
Better Maintenance Management (Preventive and Corrective)
Productivity analysis
More accurate information can be determined about the cost of production
Temperature and Humidity Loggers
This application is commonly used in the food industry, pharmaceutical storage and transportation
Monitoring temperature and humidity data in real-time for goods in cold storage and refrigerated transportation
Environmental data can be easily monitored through graphs and notifications, with document generation according to Hazard Analysis and Critical Control Points (HACCP) principles
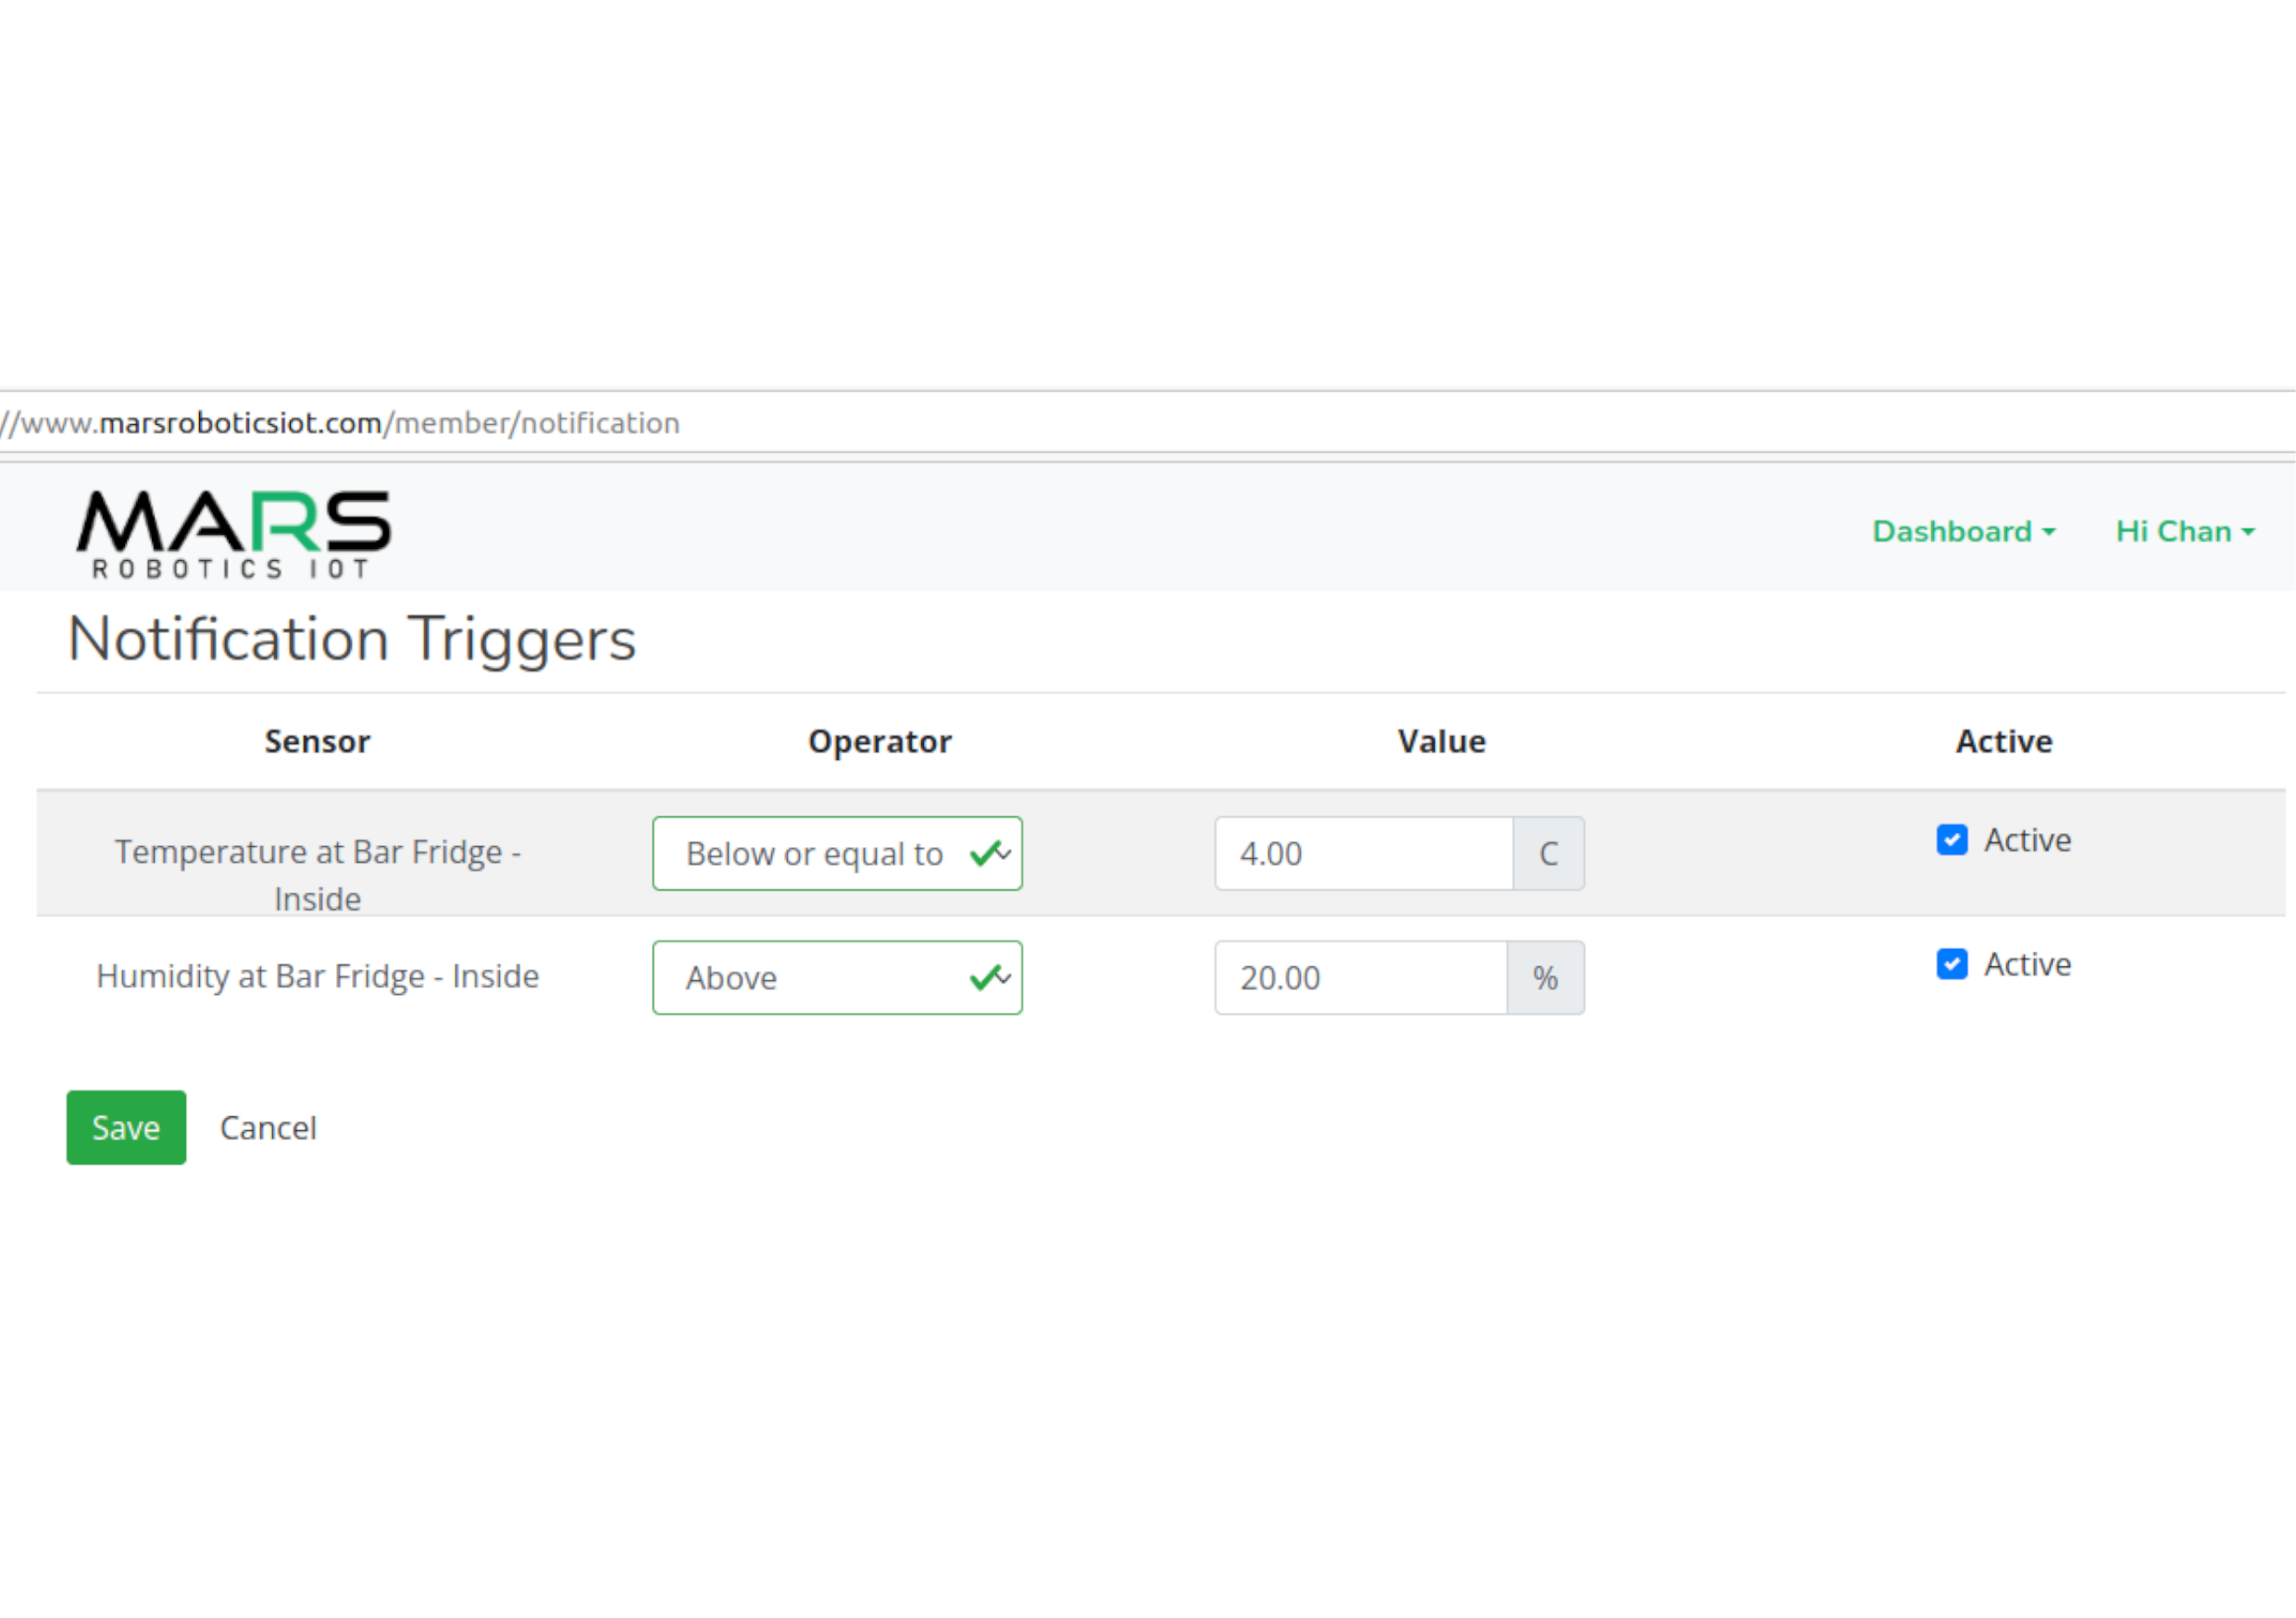
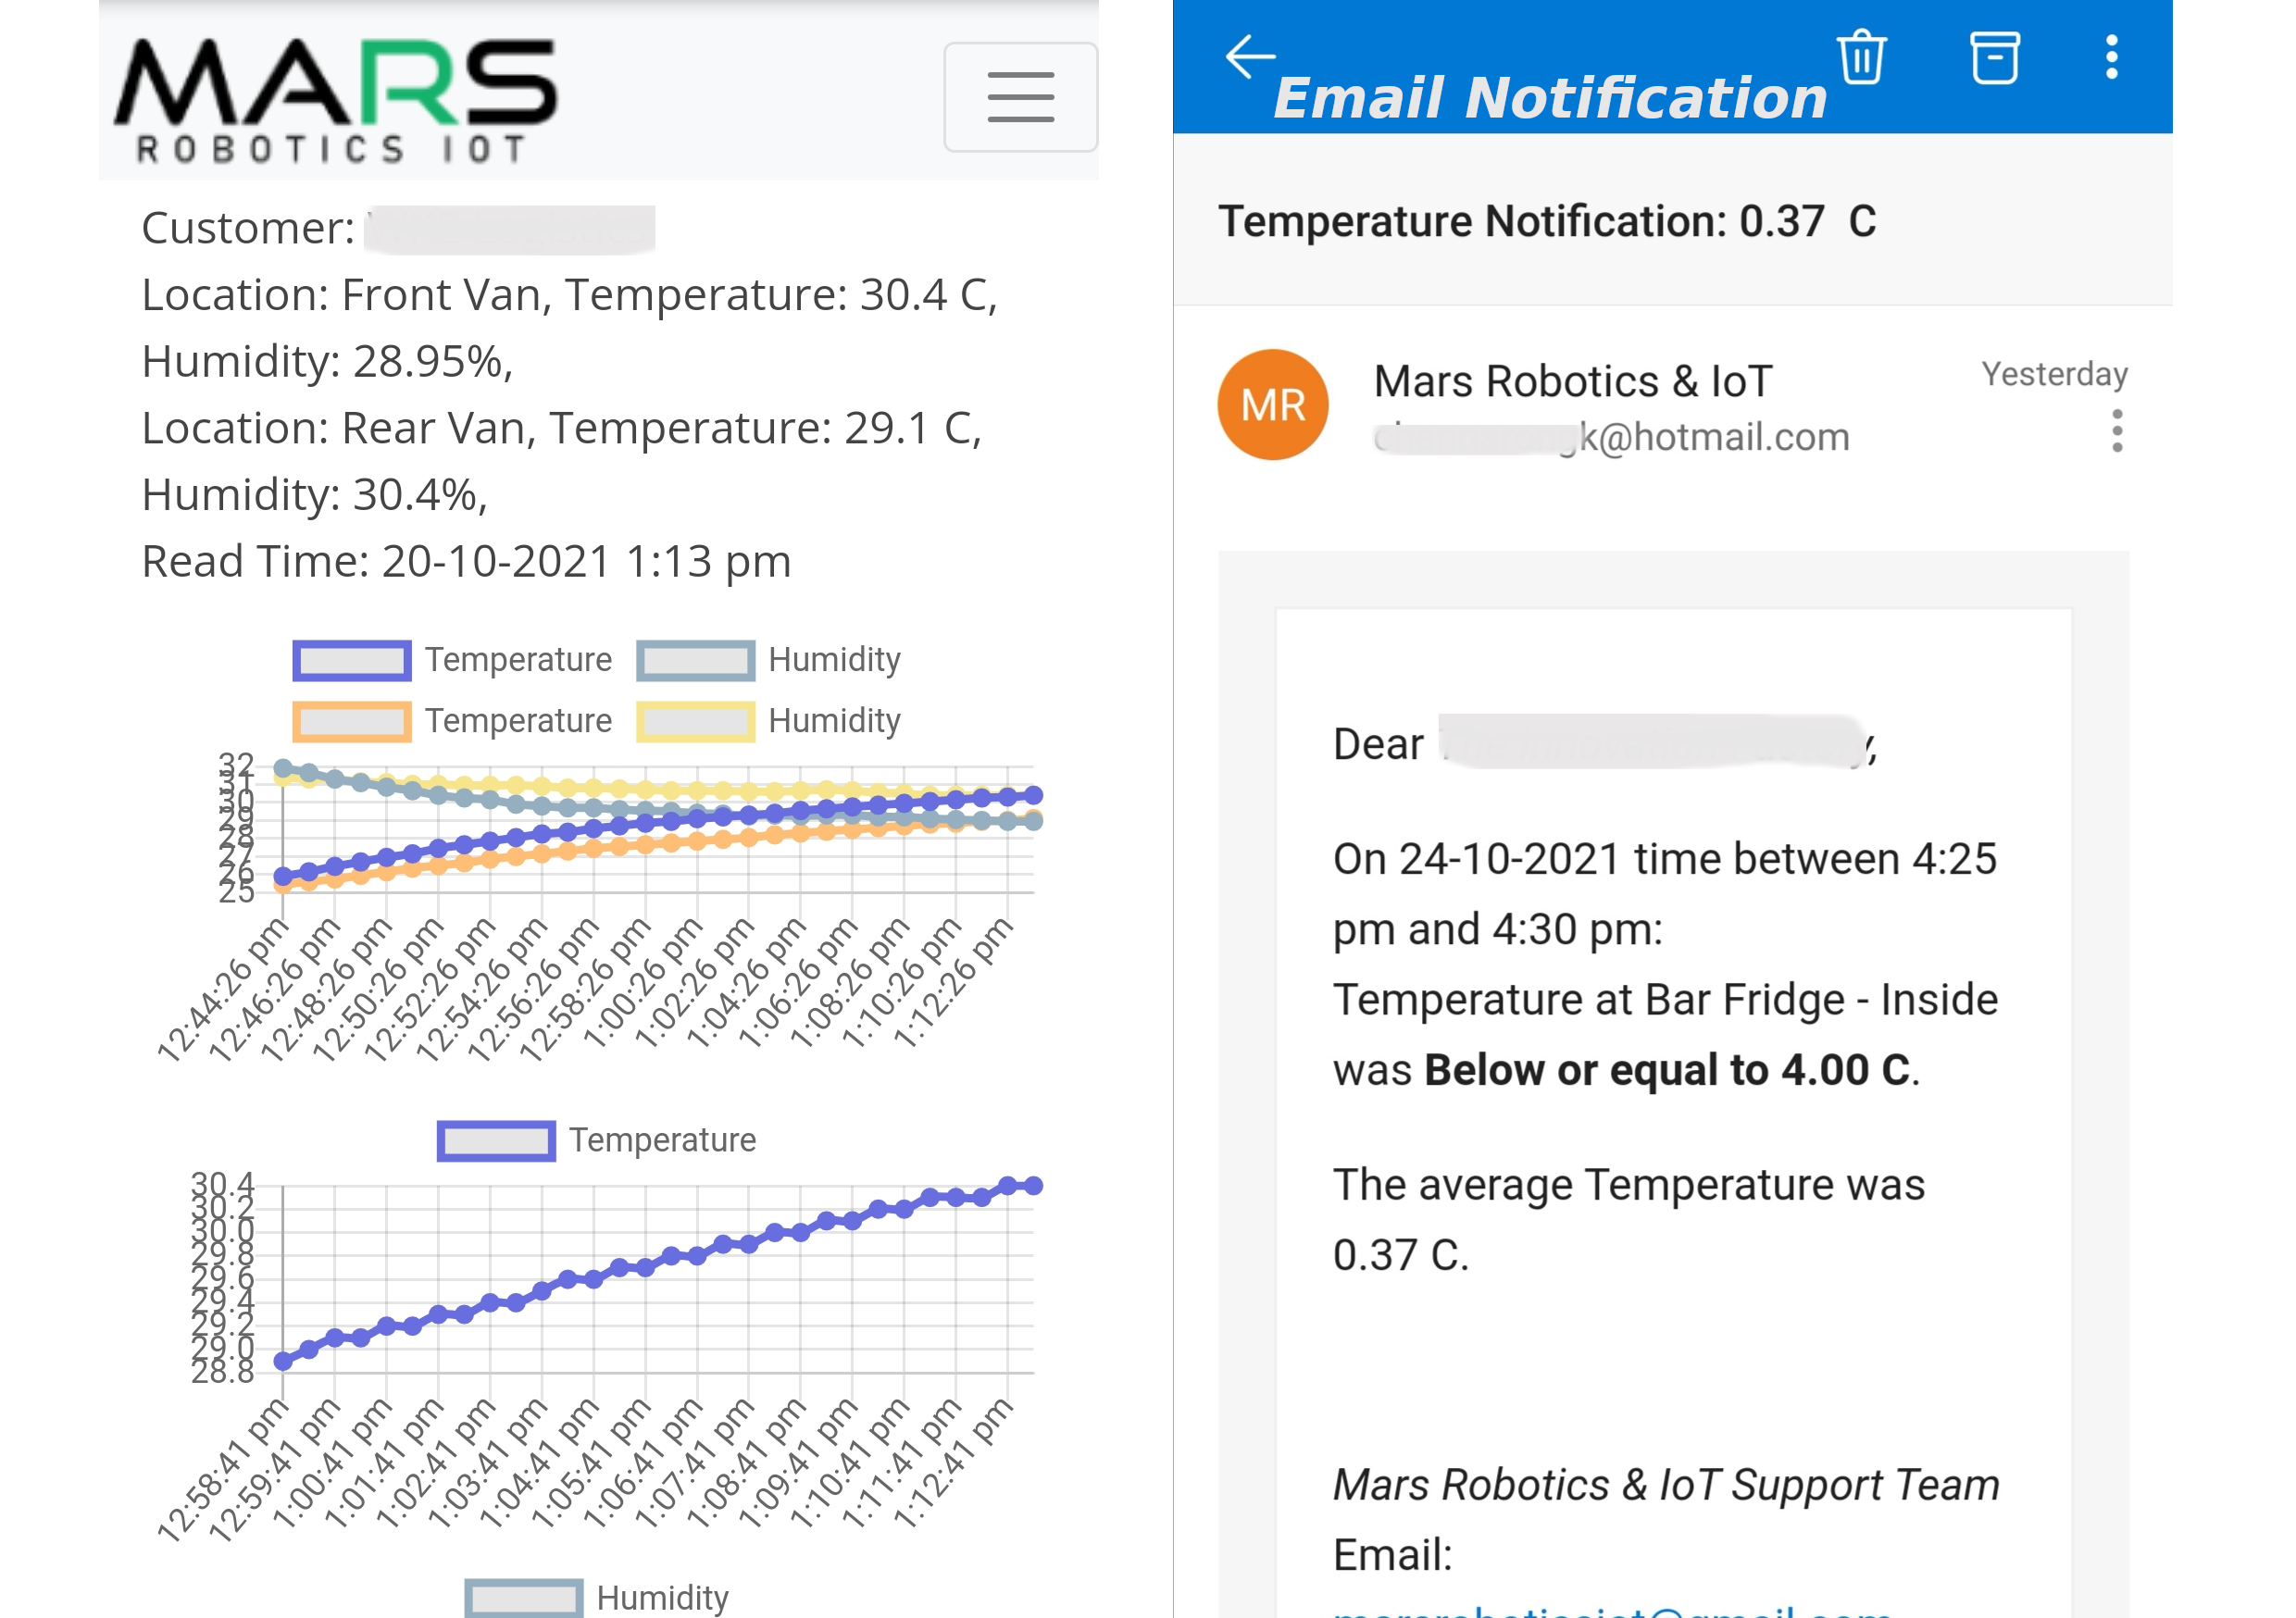
IoT systems can send notifications (by email and/or SMS) for maximum or minimum values, with averages based on specific intervals, according to customer needs
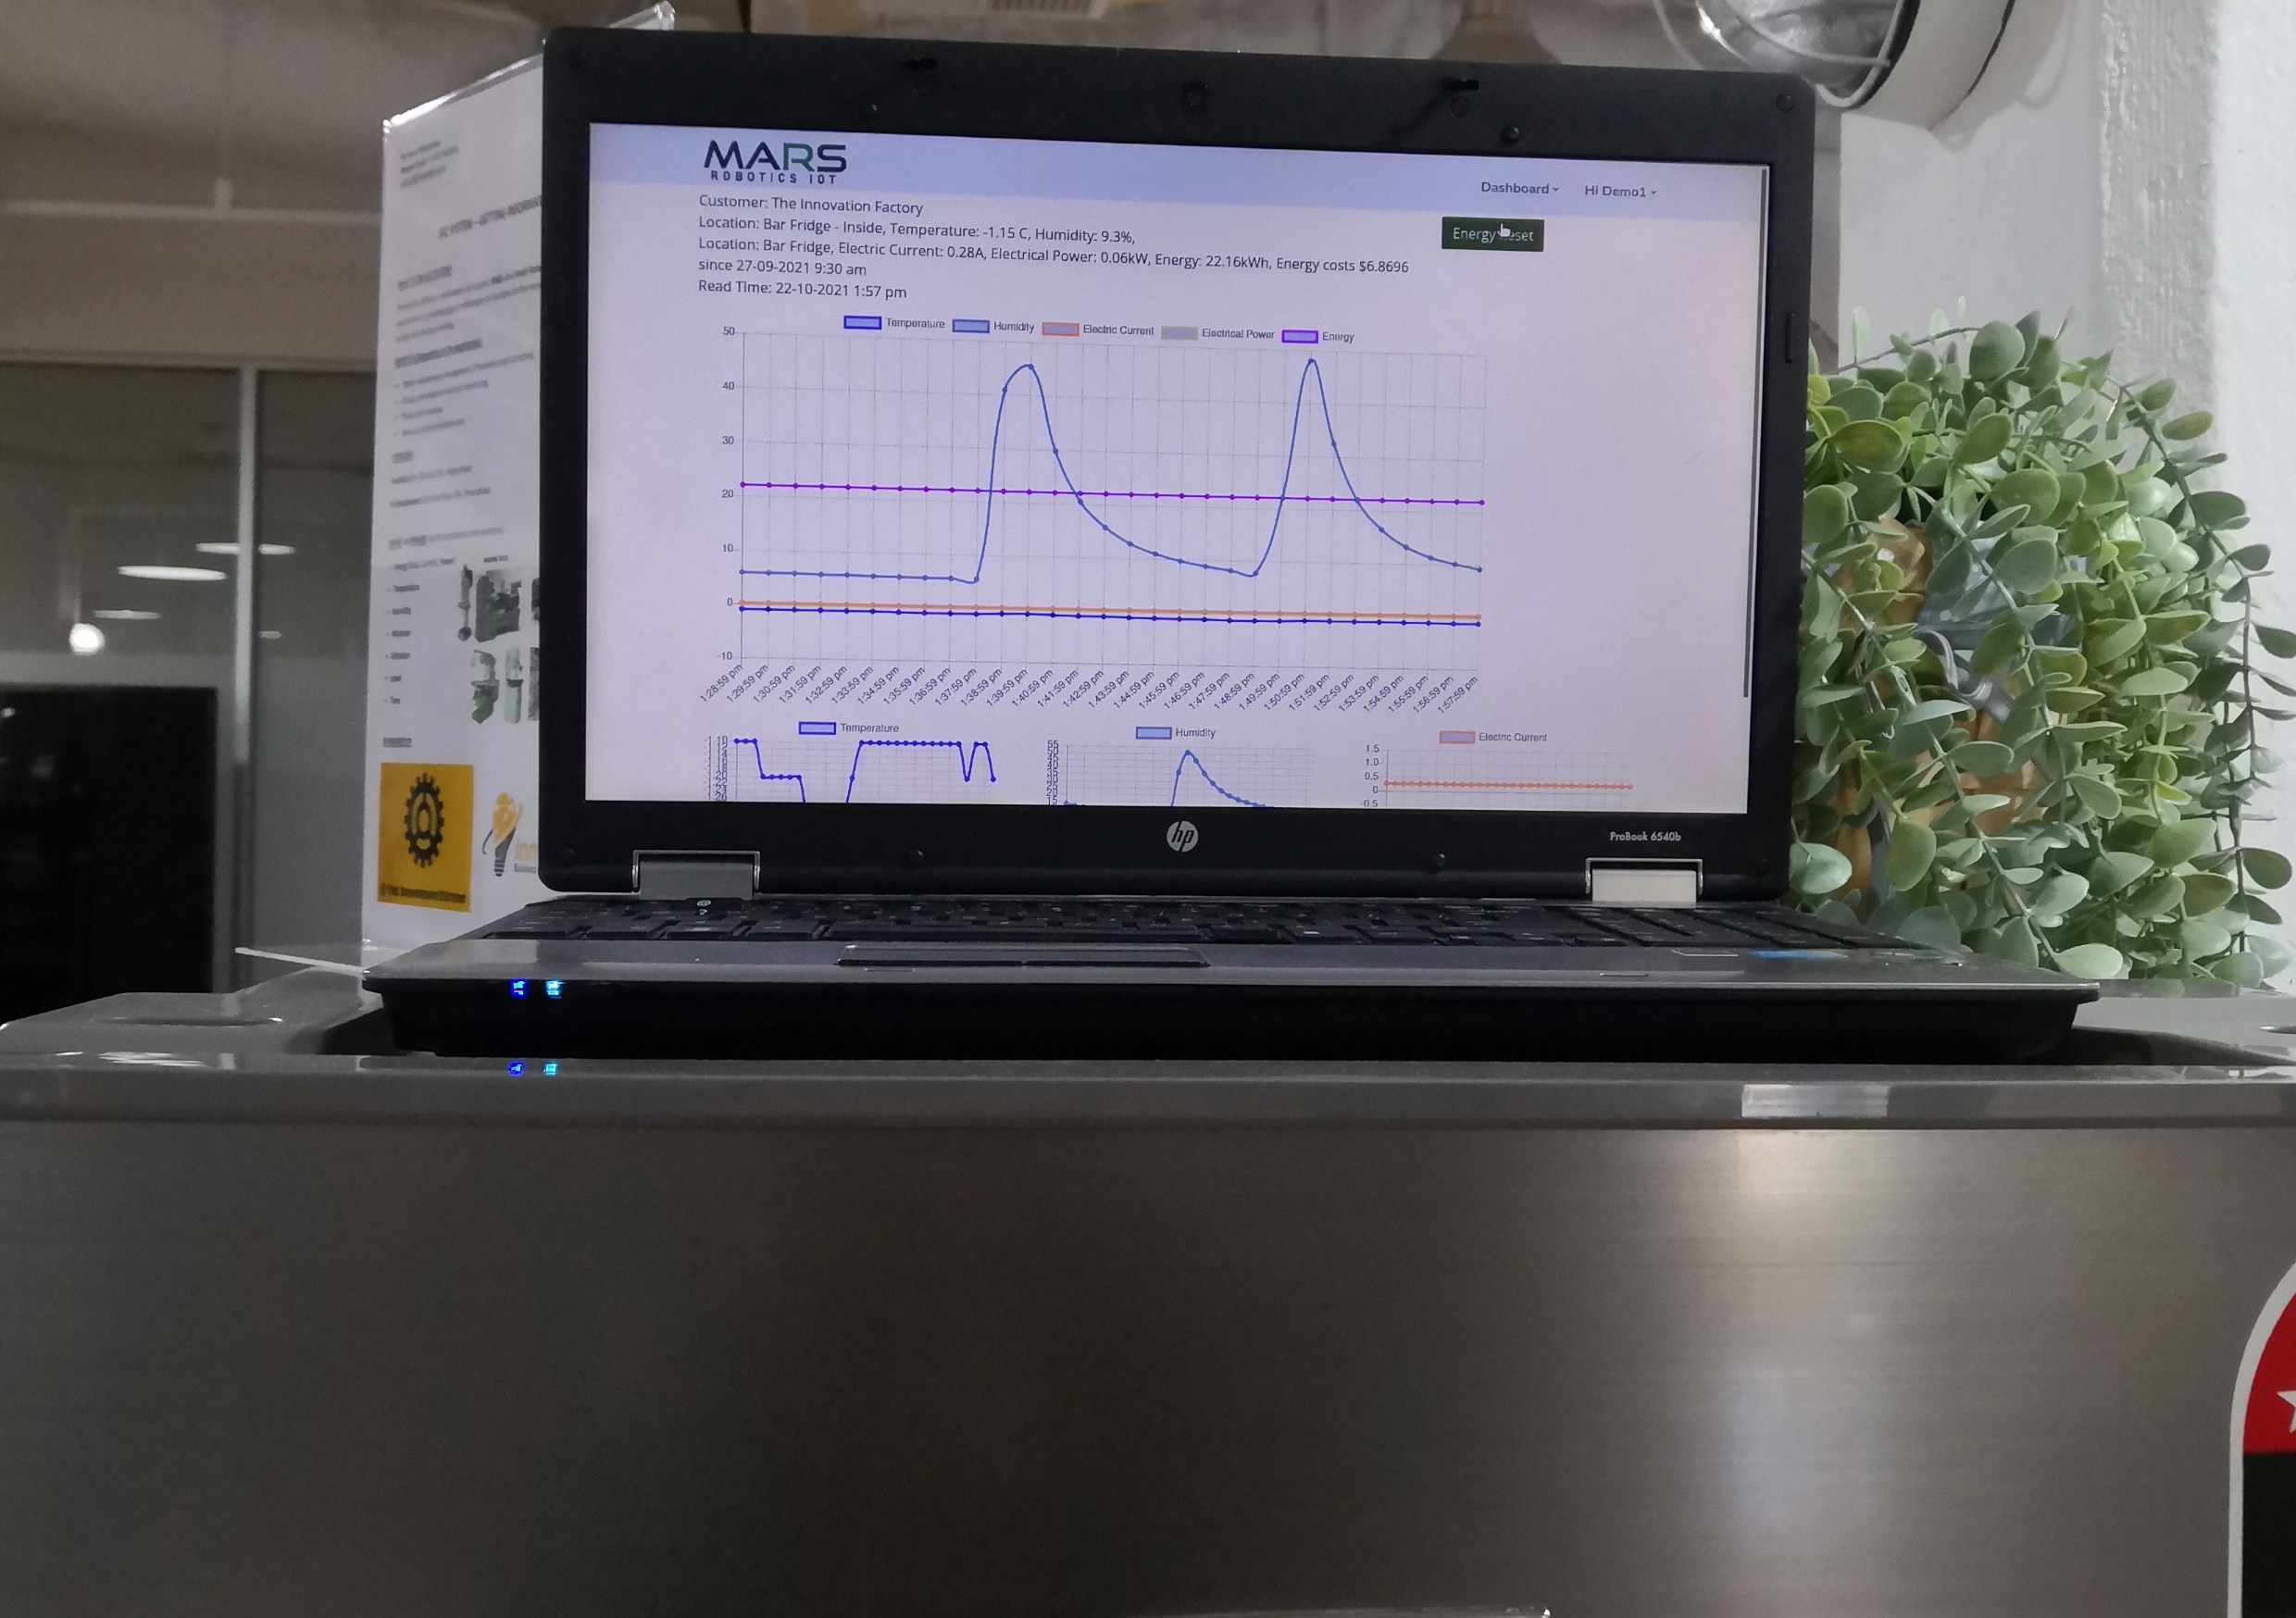
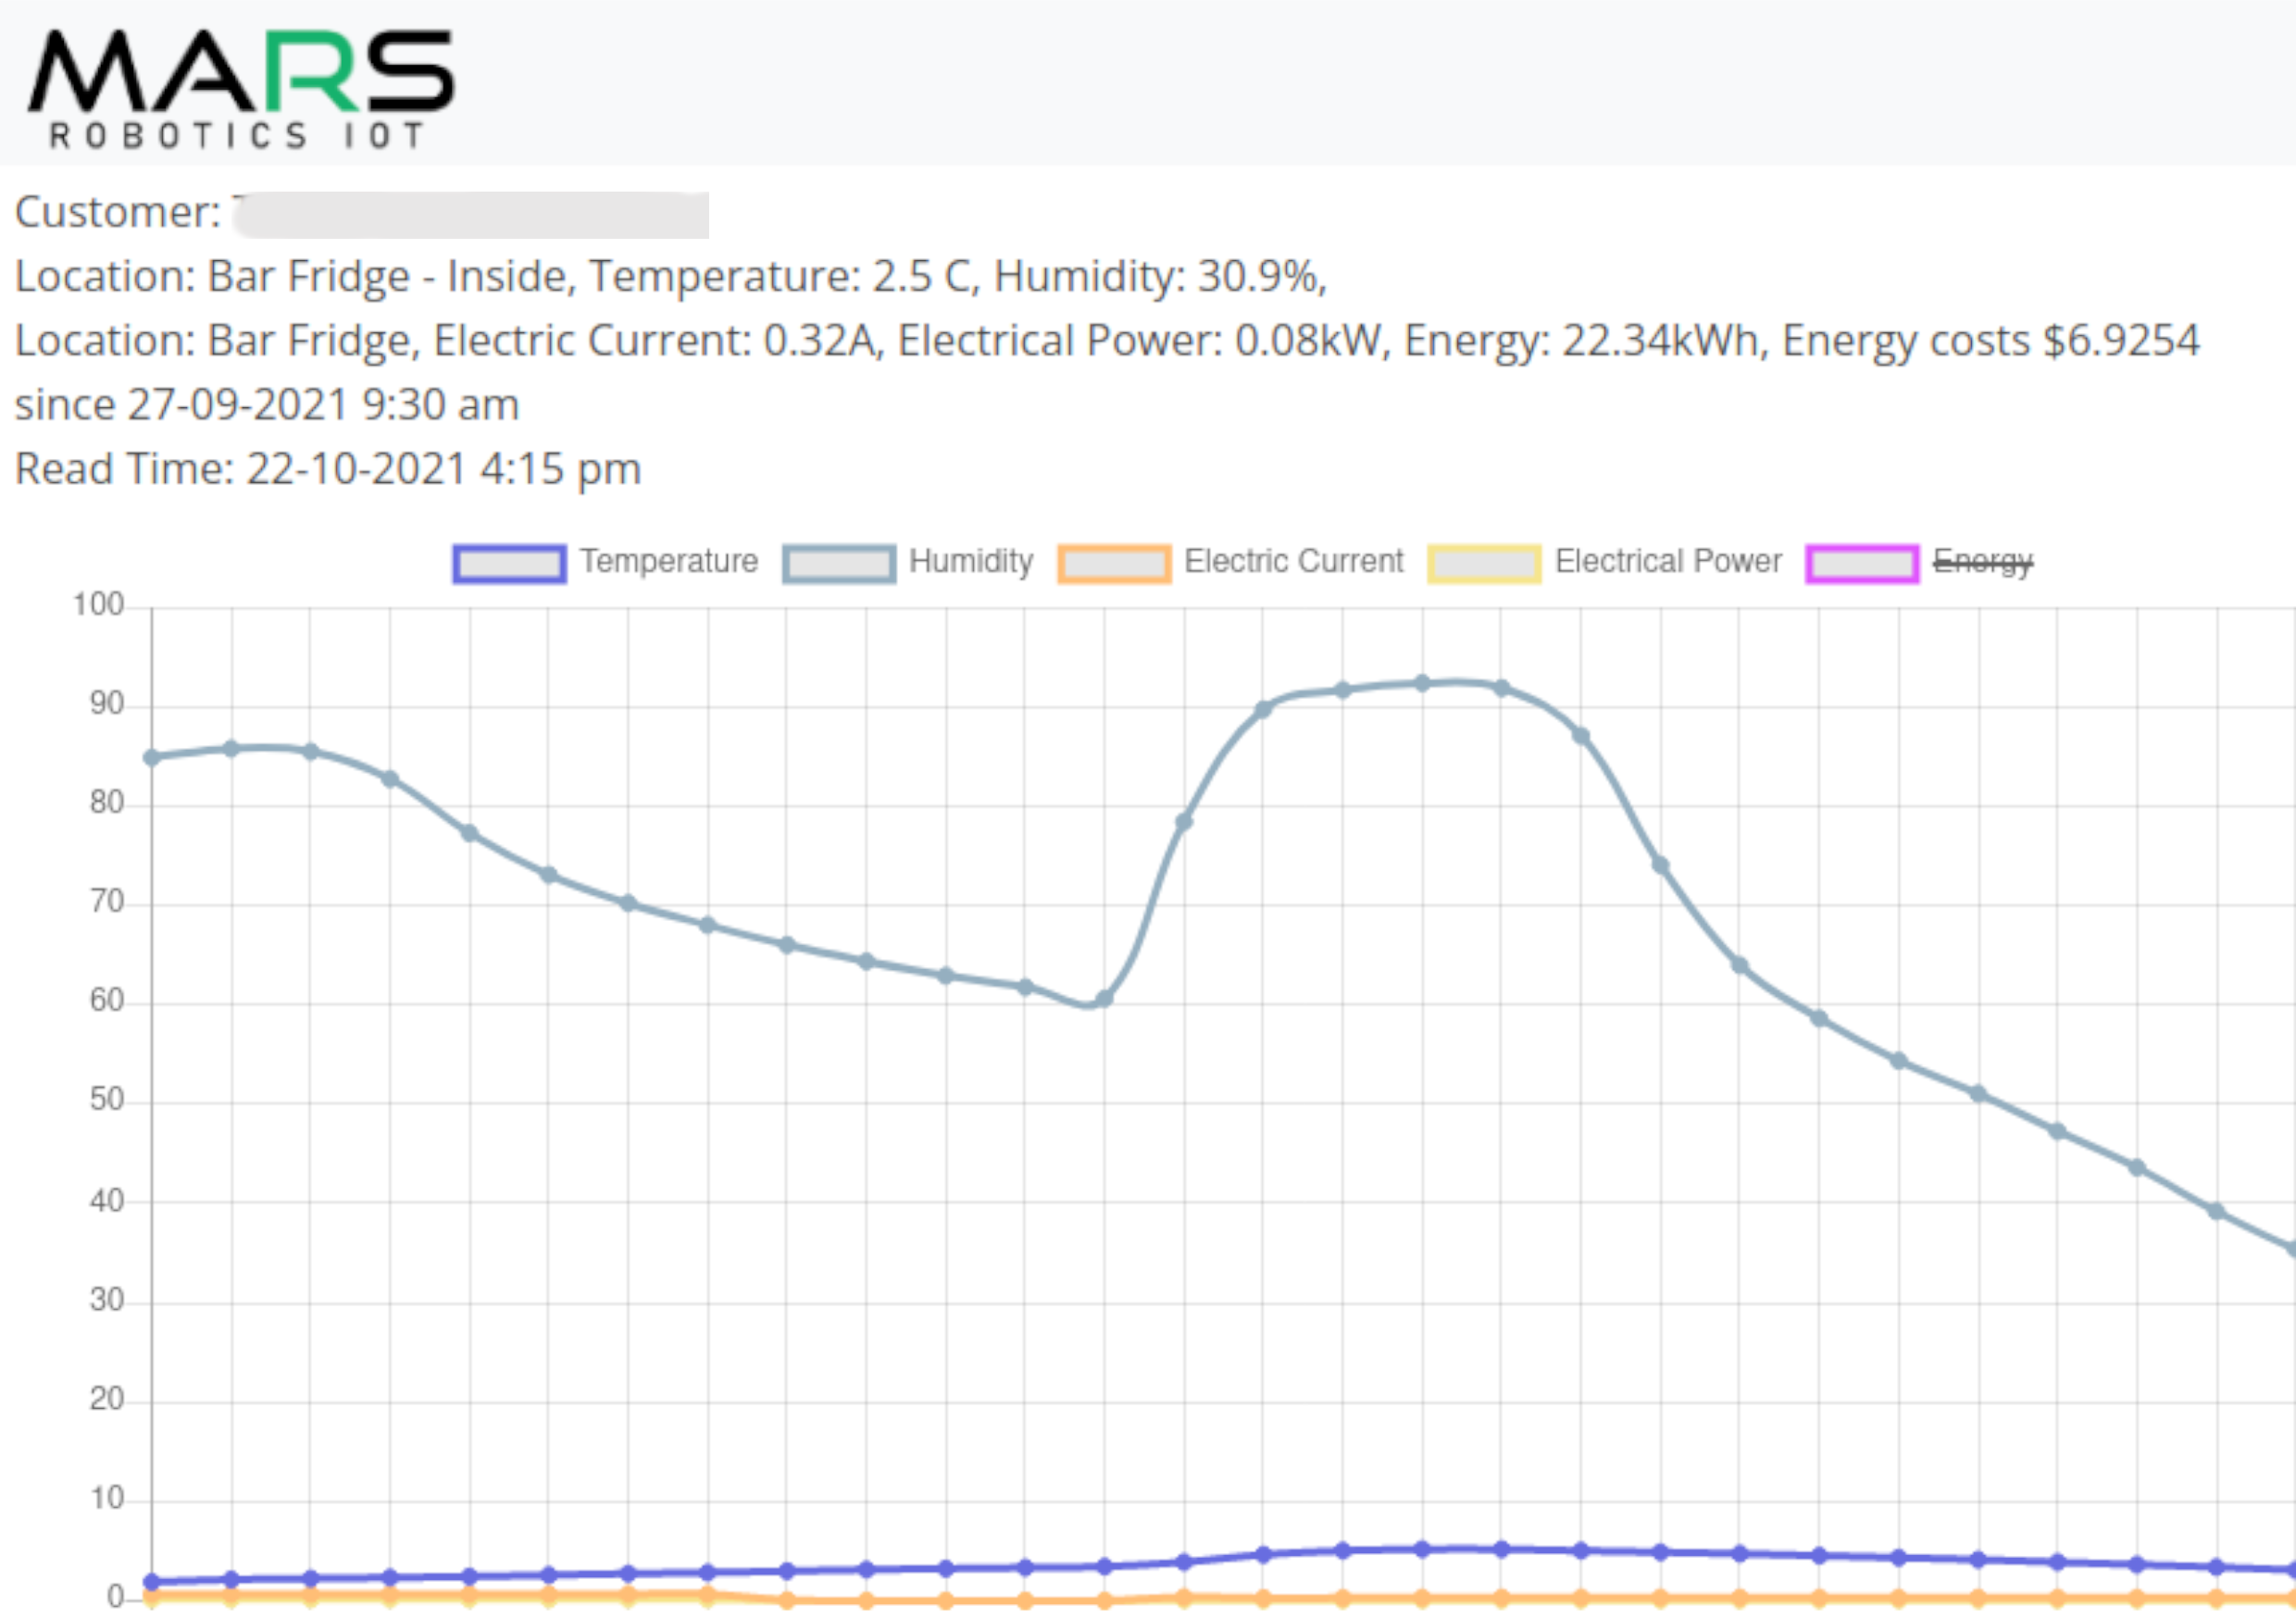
Energy Loggers
Businesses use the Energy Loggers to: collect information about the energy that is consumed by equipment; to provide digital information in real-time for the monitoring of processes; to alert when critical conditions occur; and to help with decision making.
The loggers are available for single-phase and three-phase equipment.
Sample screens
 |
 |
 |
 |